
Whats next?
Whats next?

Sentiment & the magazine covers
As I said in the previous report: Magazine covers from especially Barrons usually mark U turns in trends. It looks like they did it again….
In the chart below I show some covers and their timing. Magazine covers show the general sentiment of the people.
There are more examples. But this should be enough to proof the point.

What about the fed pivoting?
Easy to forget that the 1973-74, 1981-82, 2000-02, and 2007-09 bear markets all unfolded AFTER the initial Fed pivot. The '73-74 pivot was short lived amid high inflation. Unless market internals are favorable, pivots amid recession risk say "something just broke".
From my boy @hussmanjp on twitter.

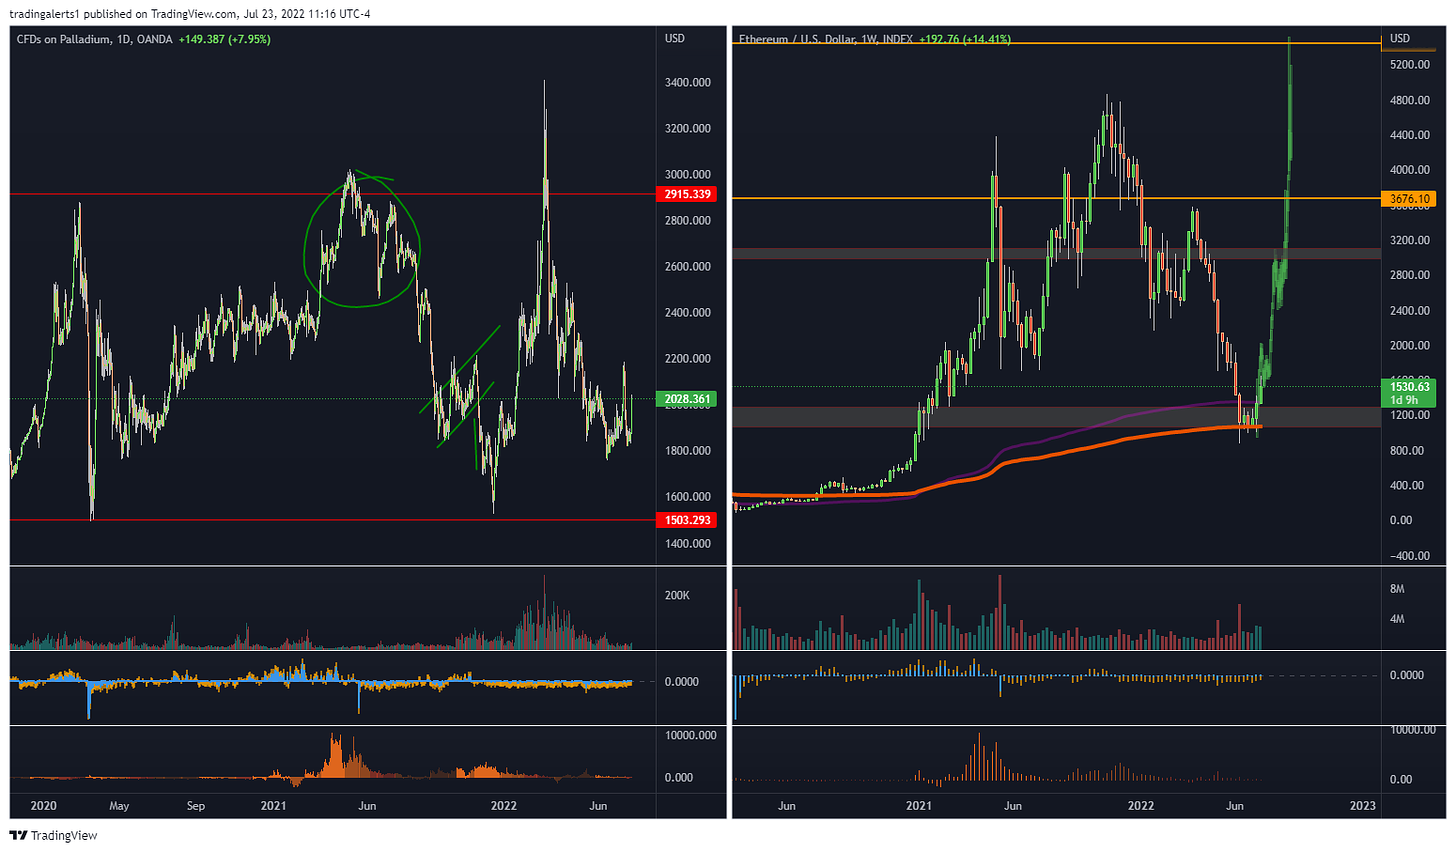
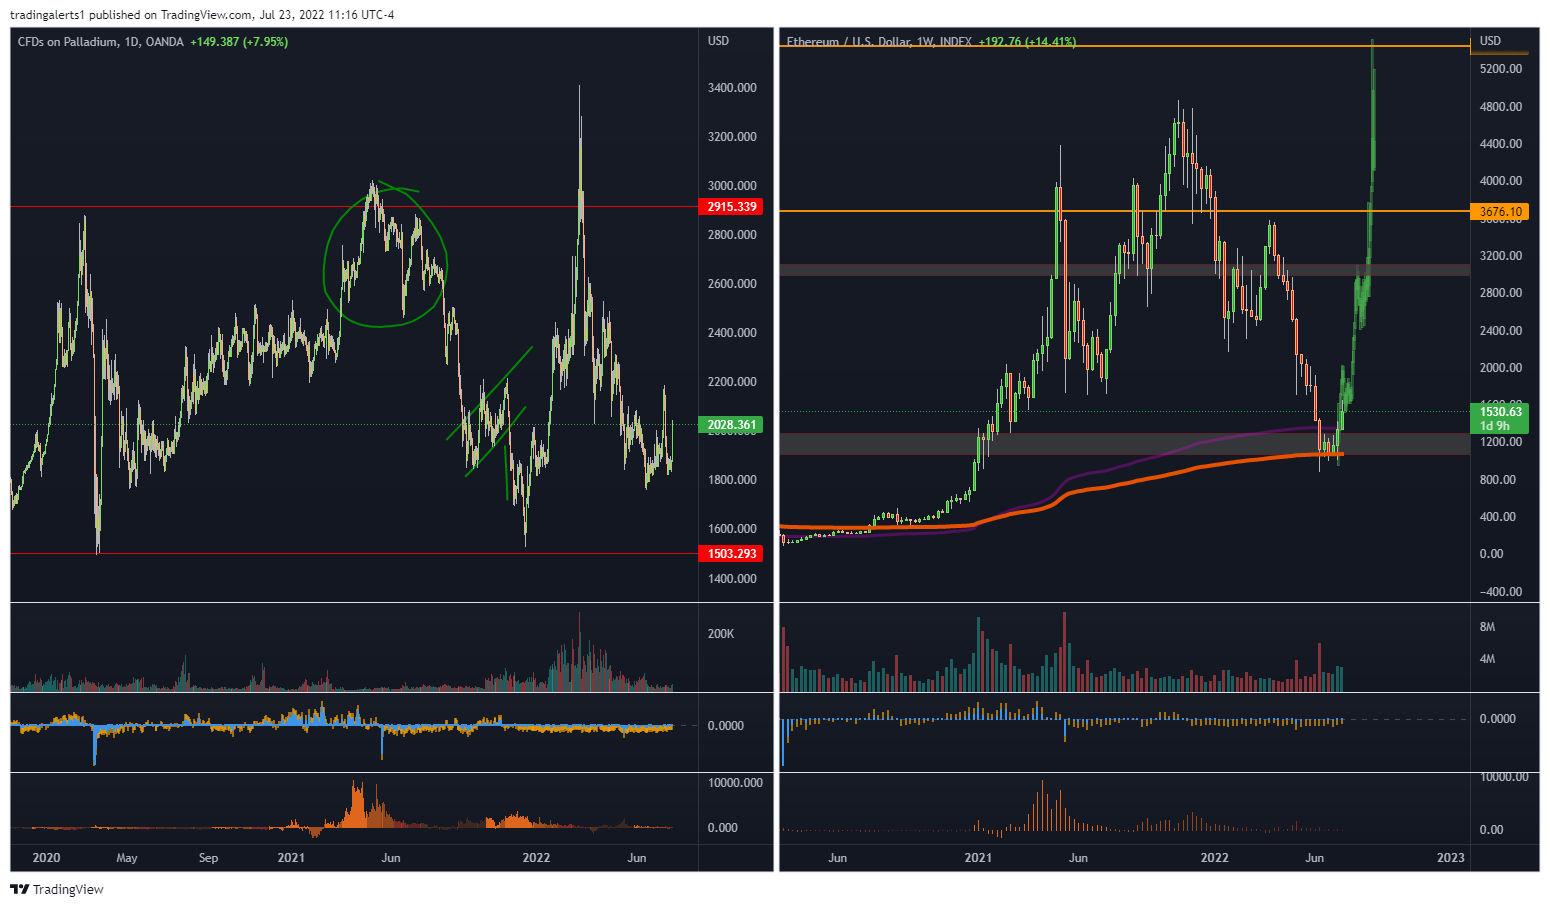
Ethereum & the palladium blueprint
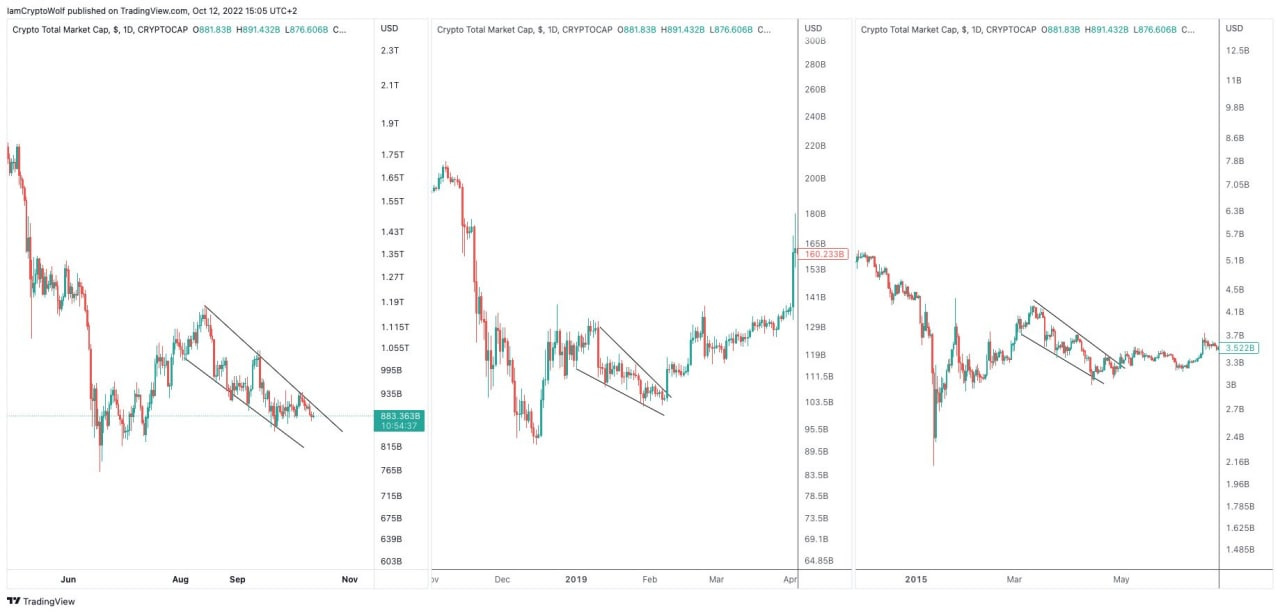
As you can see in the charts below (previous report & current situation) the general trend of Ethereum is still following the Palladium blueprint. I previously thought the bottom would form quicker, this wasn’t the case. But this doesn’t mean the Palladium blueprint is invalidated. The waves are still the same.
Previous report
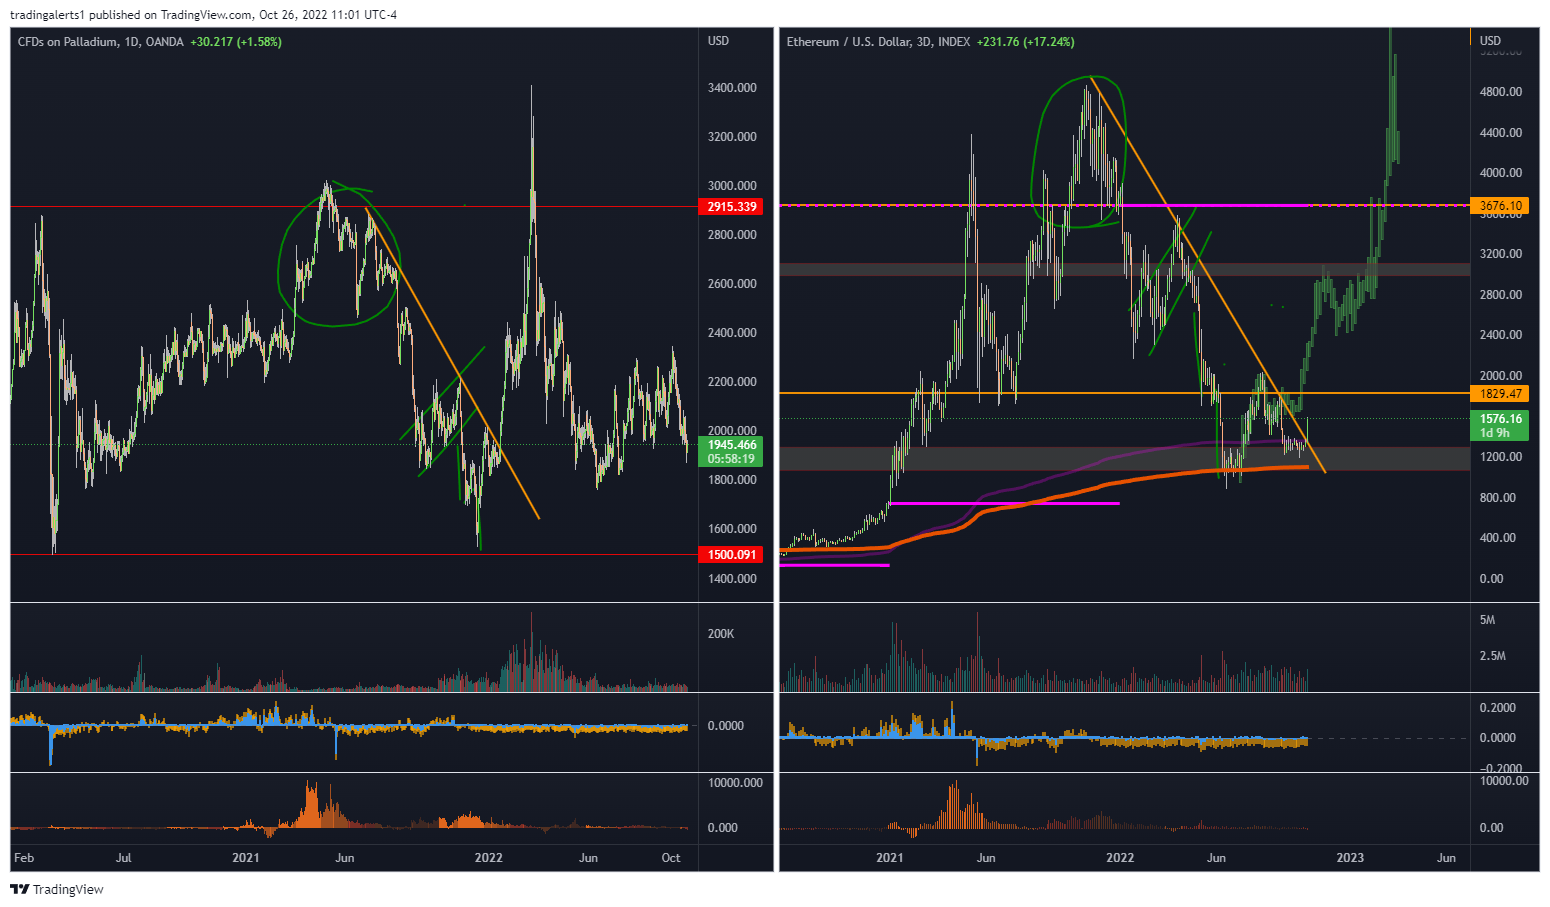
Current situation

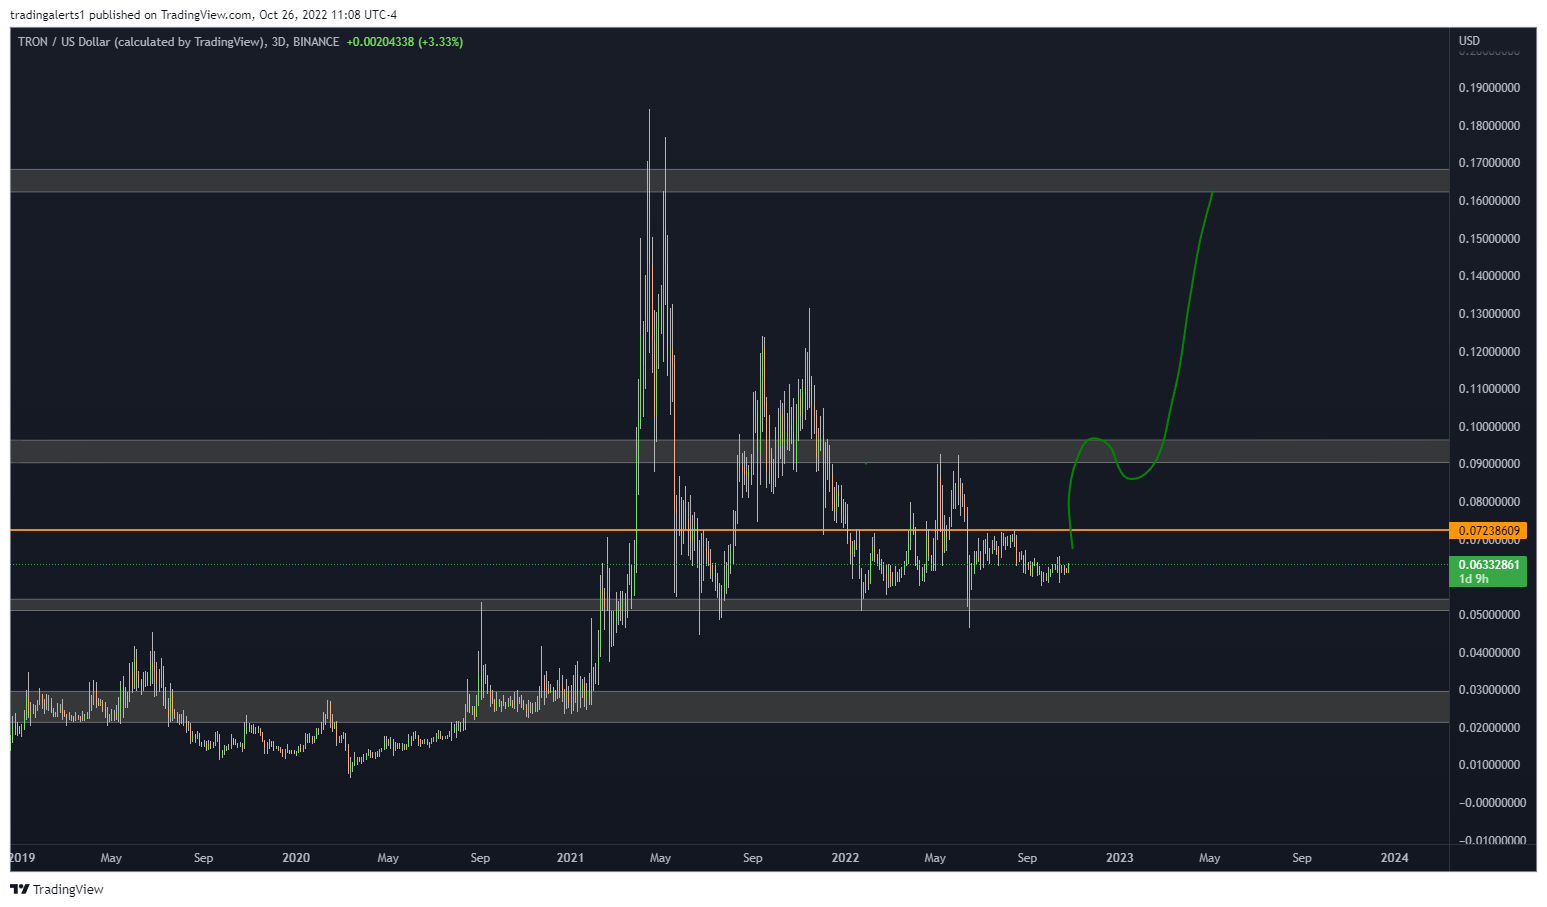
TRX & the sugar blueprint
Previous report
As you can see in the chart below I made a comparison the sugarusd chart and trxusd. As I’ve talked about earlier; commodities and crypto charts have a lot of similarities.
To make things more clear I’ve colored the market phases of sugar and trxusd.

Current situation
The current situation shows that the blue dump phase in the chart above was likely the last one. I previously thought the move higher would be quicker. But in fact we traded near the lows longer than I expected. However this doesn’t change anything about the eventual outcome.


ZRX & the sugar blueprint
Previous situation

Current situation


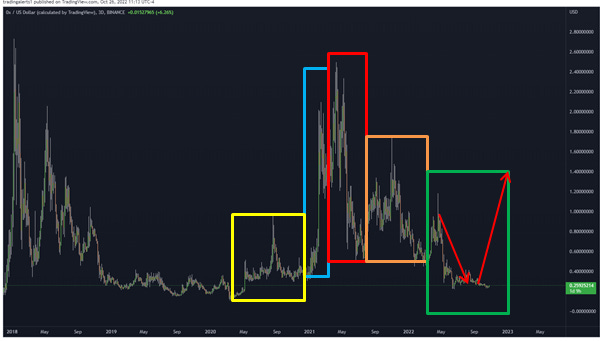
Bitcoin; whats next?
Blueprint with levels

The DNA of a bottom


What do the indicators say?
Hash Ribbons
The Bitcoin Hash Ribbon indicator tries to identify periods where Bitcoin miners are in distress and may be capitulating. The assumption is that such periods can occur when the price of $BTC is at major lows, and may therefore present a good opportunity to buy the dip.
The role of miners is to secure the Bitcoin network and to process every Bitcoin transaction. There can be periods after the price of bitcoin rallied and then aggressively pulled back that some miners struggle to financially continue in the short term. When this happens they turn off their mining rigs.
As the author of this indicator Charles Edwards states in his article Hash Ribbons & Bitcoin Bottoms, “When miners give up, it is possibly the most powerful Bitcoin buy signal ever”.
This indicator does not try to time the perfect bottom in price. Rather it shows periods where Bitcoin mining rigs are being turned off due to the challenging market conditions, causing drops in hash rates. These can often be areas of macro bottoms in Bitcoin price.
For a strategic long-term Bitcoin investor, these periods can be favorable times to accumulate Bitcoin and therefore present a buying opportunity.
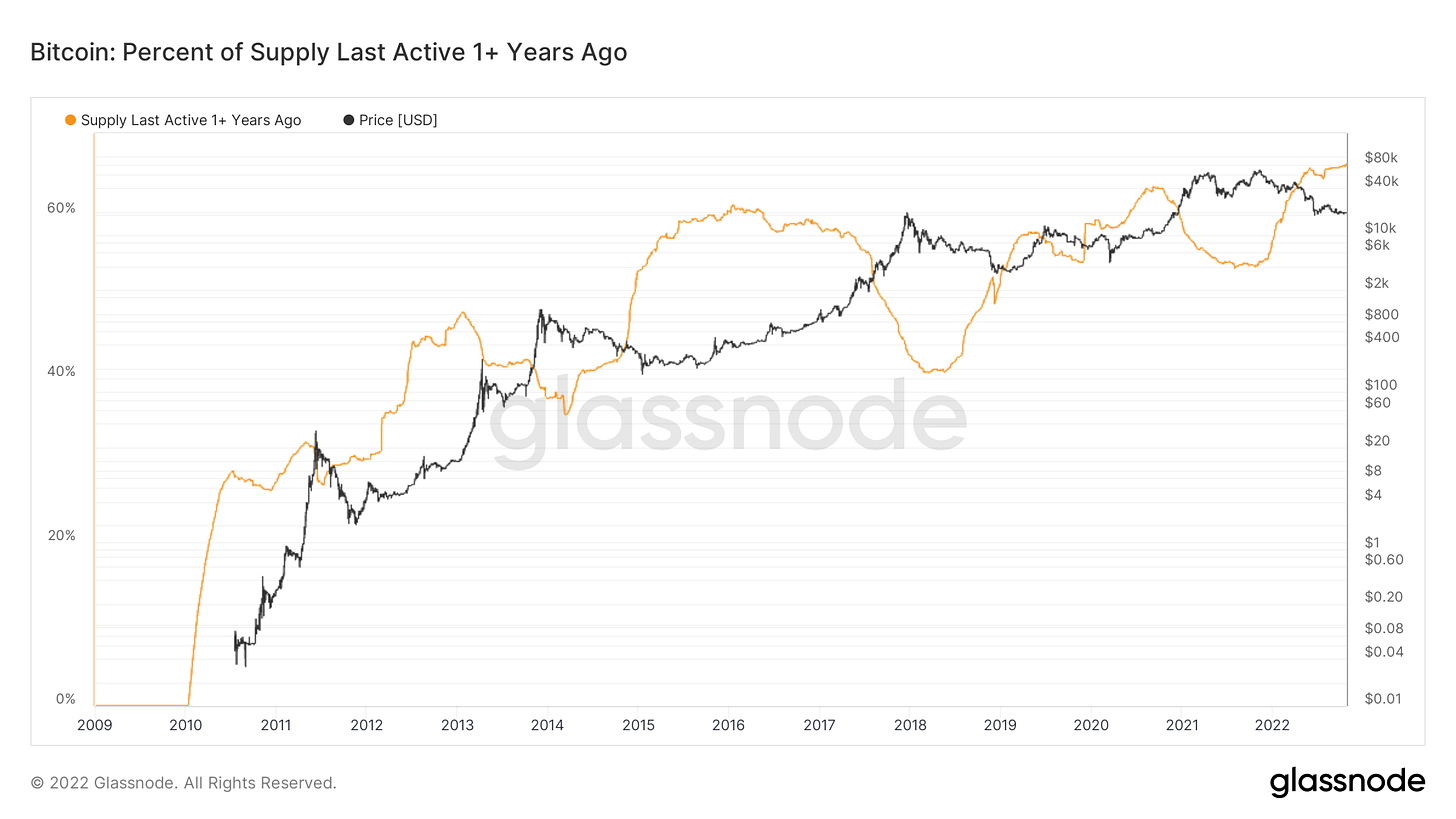
Percent of Supply Last Active 1+ Years Ago (On chain)
On chain supply last active looking good. You can see below (edited in green and red phases) as the line goes down, prices go up.
The chart below is from a previous report.
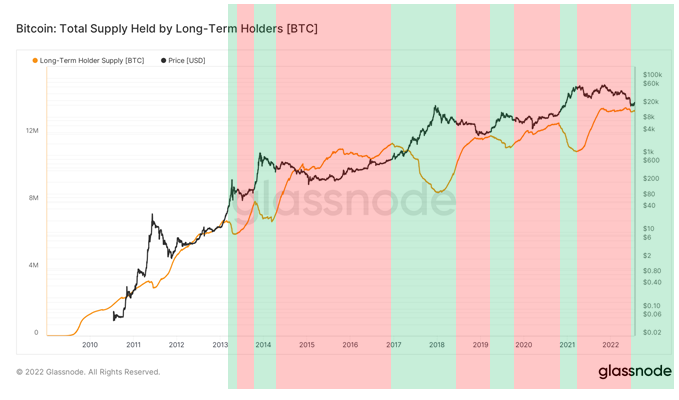
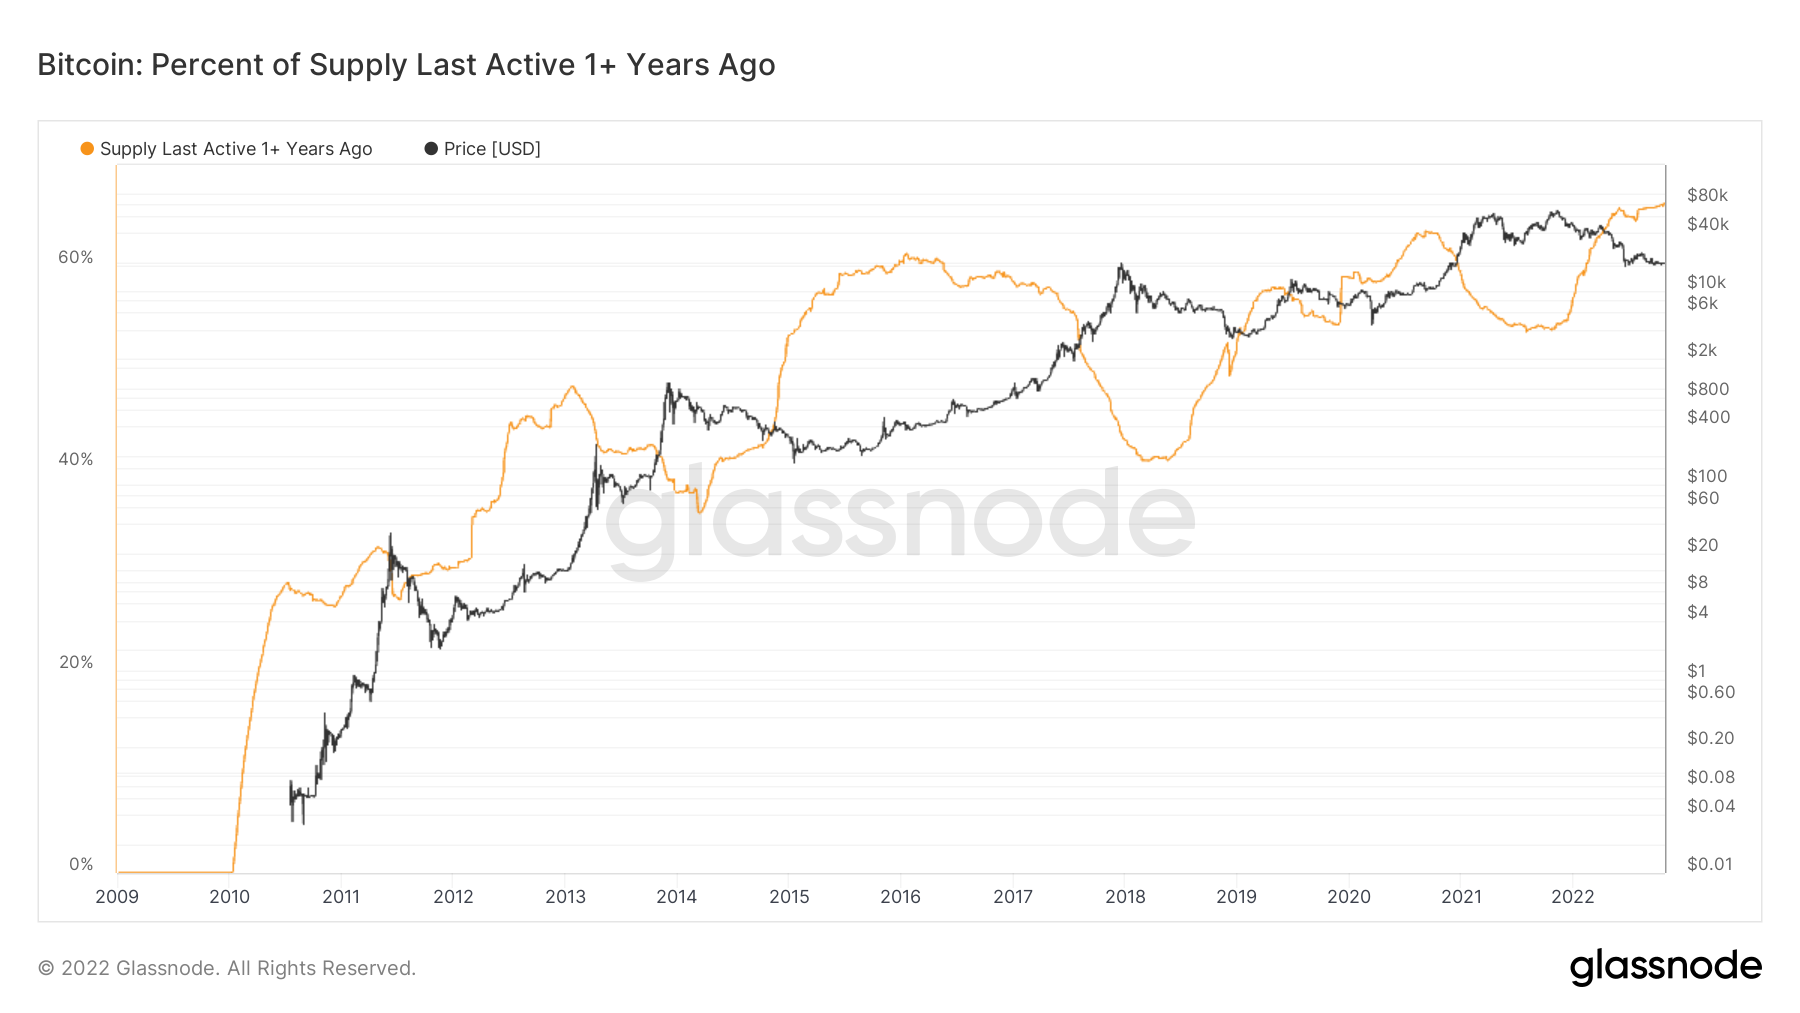
In the chart below the current situation is shown. The trend is still flat-lining which is a good indication for a bottom.
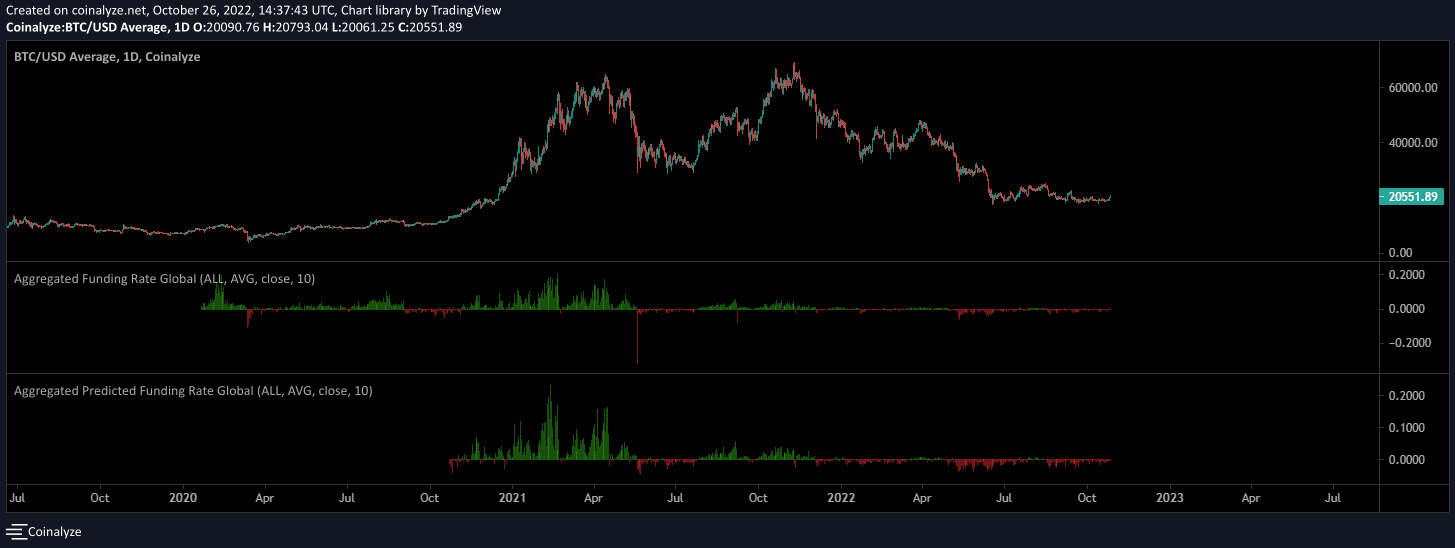
Funding rate
The market is still heavy short. As you see you can see the funding rate is more negative compared to previous bottom and for a longer period of time. So we can assume that the open interest in the market is short.


Whats next for BTC.D?
I think the ‘‘muh macro’’ zone will keep acting as resistance. So I currently think alts are the better play over Bitcoin.
Under the valhalla zone I’ll be looking for an altseason.

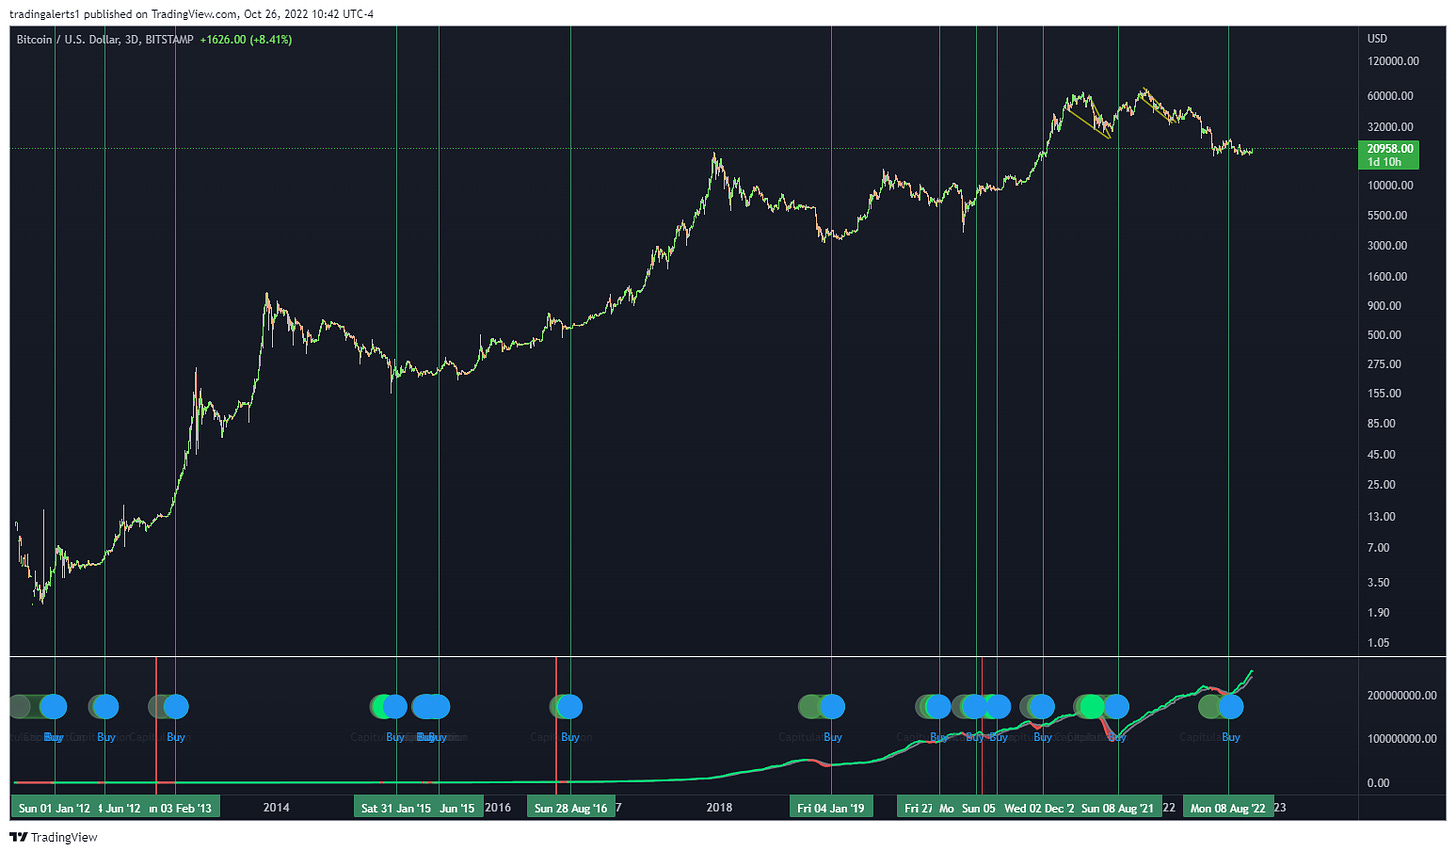
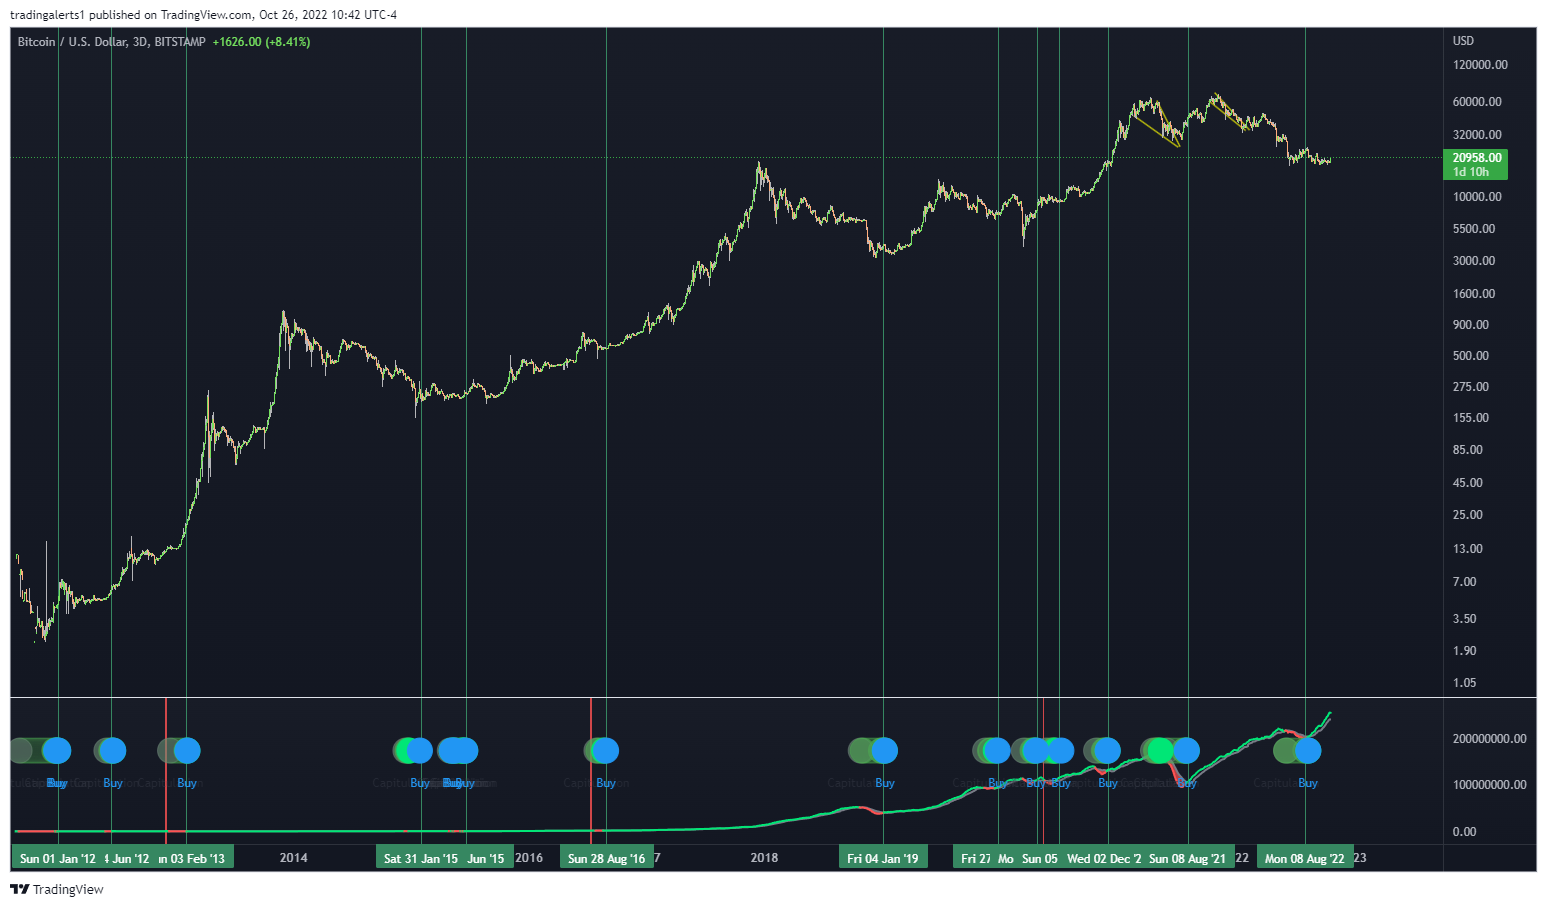
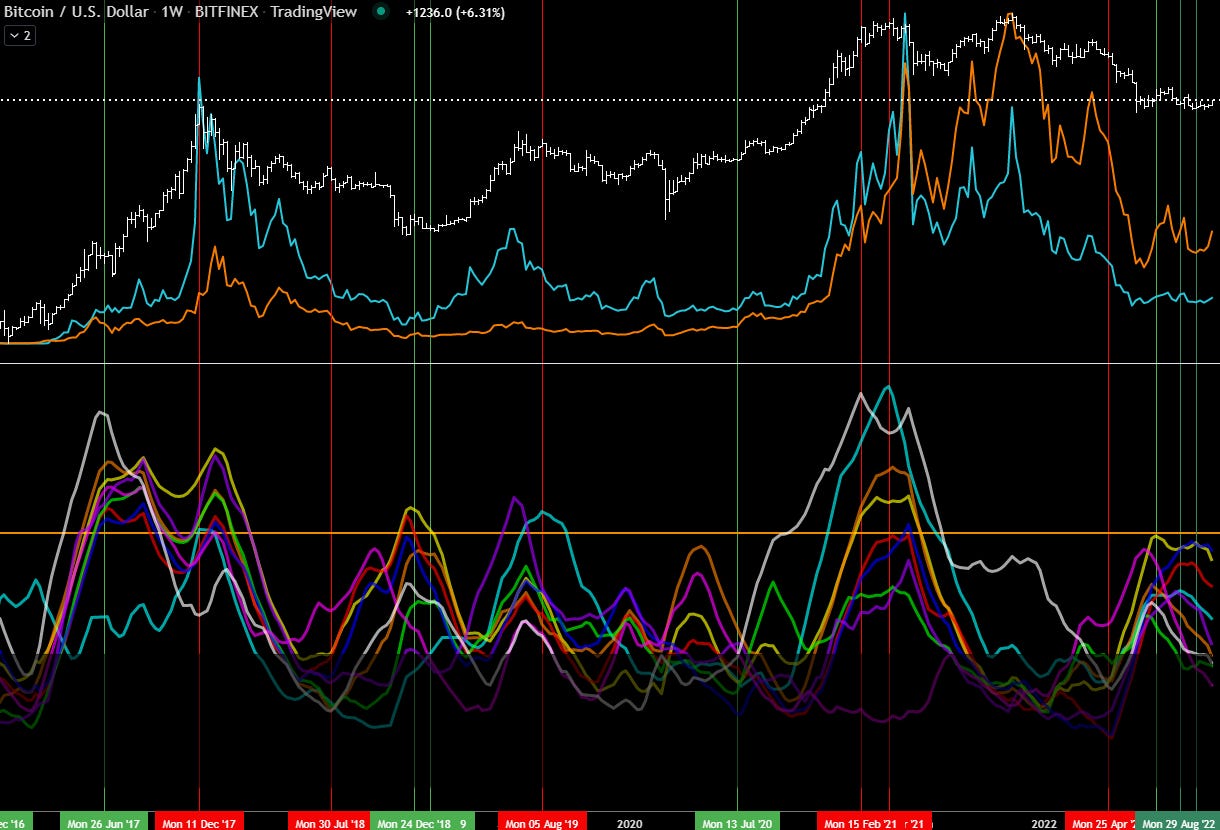
What does the Proton Algo say?
The Proton Algo is the algorithm I’ve build from 2014-2016. Below you can see all buy signals (green vertical lines) and sell signals (red vertical lines). As you can see it has a 100% hitrate in the long term. Three buy signals have been printed since the June bottom.
What’s next for gold?
Gold is currently in a channel (orange lines). When this breaks upwards its time to long.

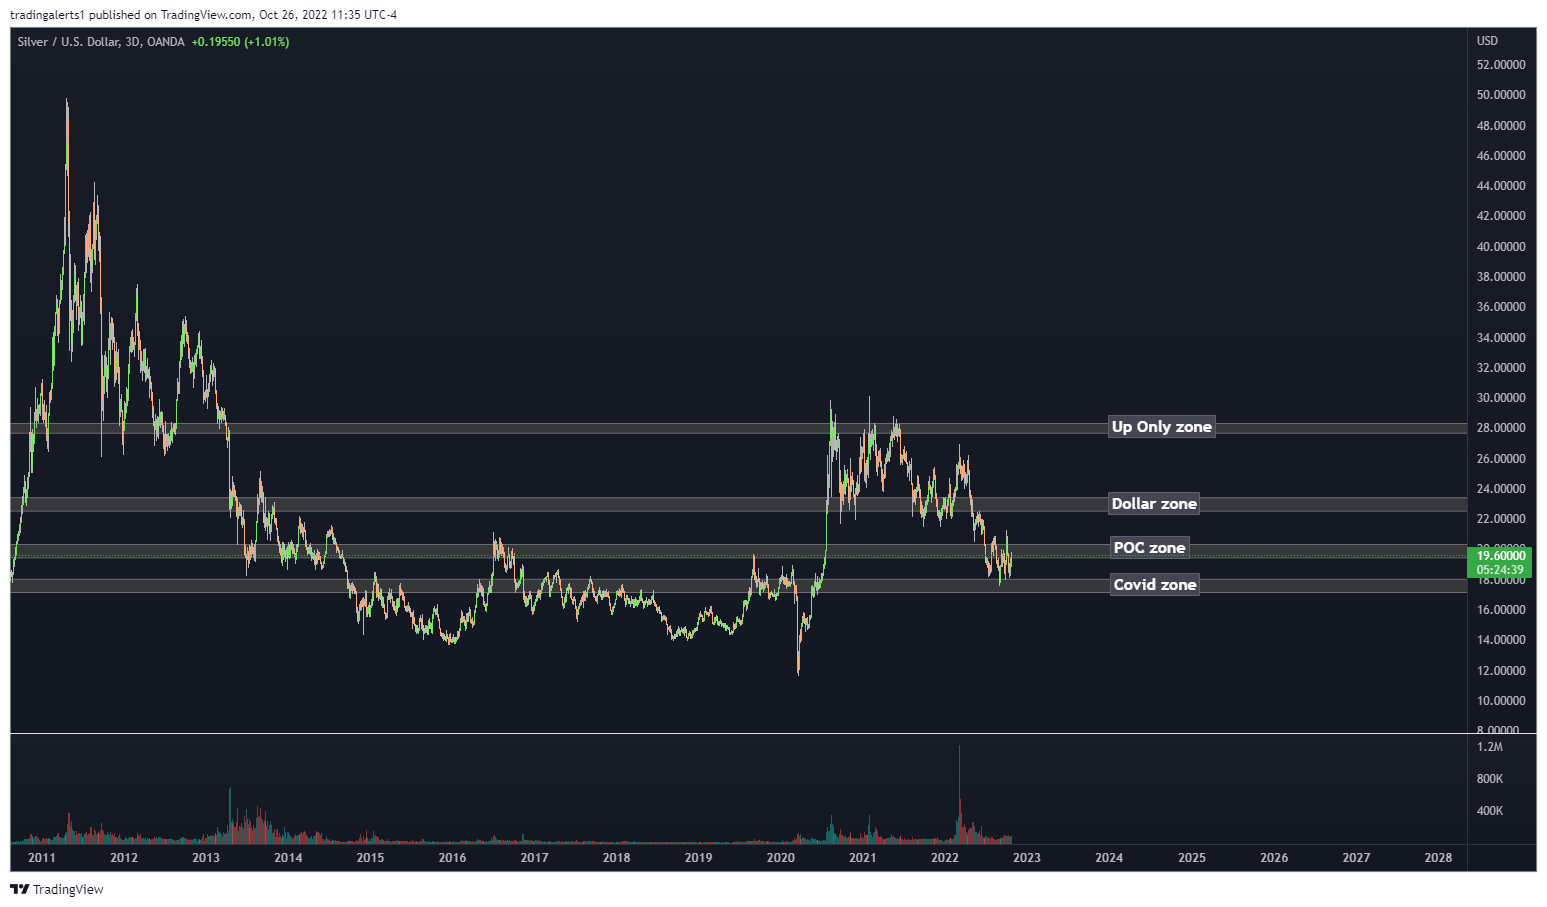
What’s next for silver?
Silver is currently in a chop zone. But ones it breaks above the POC zone its a decent long. Stop loss would be under the Covid zone.
Preview of the upcoming report…
Marijuana stocks
